patinnc.github.io
60secs project page
Table of Contents
Introduction
60secs is a linux server data collection and analysis tool
- Based on the ideas in Brendan Gregg’s “60secs to performance analysis”
- Do data collection for: uptime dmesg vmstat mpstat pidstat iostat free nicstat sar_dev sar_tcp do_top perf sched_switch interrupts flamegraph toplev power watch
- Designed to run on cloud servers. Developed using debian based servers.
- Uses standard linux utilities
- Bash scripts and awk are the glue running the scripts
- I have a utility to launch the script on servers and retrieve the output from the servers into an archive dir
- Data analysis (requires python)
- combine (average) data from 100s of servers
- compute summary data (min, max, avg) and pXX stats (like p50, p90, p95, etc) across the servers
- output is an Excel spreadsheet: uses John McNamara xlsxwriter
- summary sheet (min, max, avg, pXX stats)
- chart sheet
- 1 sheet per type-of-data-collected (ie. 1 sheet per vmstat data or perf data)
Useful for characterizing performance across a subset of your fleet.
Also useful in studying performance of new servers vs old servers.
- I’ve used it for comparing cpu2017 performance for upcoming servers vs in-service servers.
- In this mode we show each server’s performance instead of averaging all the servers.
- For instance I have cpu2017 comparison perf data by phase (subtest).
- The charts for each cpu2017 subtest are in a row-per-subtest on the charts page.
The project web page is https://patinnc.github.io/60secs
The source code repo is https://github.com/patinnc/60secs
You can get the 60secs/extras/spin.x statically binary (for debian 64bit x86 linux) from https://github.com/patinnc/patinnc.github.io/bin/spin.x.
You can get the 60secs/perf statically binary (for debian 64bit x86 linux) from https://github.com/patinnc/patinnc.github.io/bin/perf.
Data collection for 60secs
There are 2 typical ways the scripts are used:
- run the same command (or monitoring) on a list of similar hosts (I’ve run monitoring on 100s or a 1000 hosts)
- I don’t want 100s or 1000 different excel files so I average the results together in 1 excel file
- you can get pXX (p50, p90, p95 p100 etc) stats if you need them
- run different commands on the same host (say some benchmark on 25% then 50%, then 100% of the cpus on a host to see how a workload scales with more cpus).
- in this case I want to see each run to compare the performance
- the example below is this 2nd usage model
Example run: use spin.x to do:
- cpu frequency test (spin.x -w freq_sml -t 10) reports freq by doing an operation that executes 1 instruction/cycle on each cpu for 10 seconds
- memory bandwidth test (spin.x -w mem_bw -t 10 -s 100m -b 64) does read memory bw test on all cpus for 10 secs using 100 MB array size and bump 64 bytes per iterationjj
- L2 bandwith test (spin.x -w mem_bw -t 10 -s 32k -b 64). Uses 32 KB array on each cpu. My do_perf3.sh perf script doesn’t collect L2 misses so I can’t actually compute an L2 bw. But I can Collect perf data for each run:
- IPC, topdown Level 1 stall percentages, L3 miss latency, memory bw, lots of other stats
Use 60secs/install_and_run_on_cloud.sh:
- to execute a command on a list of servers (in this case just 1 server).
- to fetch the output from a list of servers.
- I’ve used it to run cmds on 100s of servers at a time
- I’ve used it to fetch the results from 100s of servers.
- the list of servers (-l host_list_file) has 1 host per line
- you can also use uns:paths
- or subset a list of hosts (-N beg_num,end_num)
- many of the commands (such as -r command or -r fetch_untar) done by the install_and_run script are done in the background by default. You set the max outstanding cmds or disable background tasks altogether (using -m 0) to serialize the output.
- if you use -r cmd then the output for each cmd is written to a file (in the ./work_dir by default).
- ‘-r cmd’ is the same as ‘-r command’ except
- ‘-r cmd’ writes the output for each host to a separate file
- ‘-r command’ writes the output to stdout
- a sample ‘-r command’ (to execute ‘uname -a’ on the lists of hosts:
./install_and_run_on_clouse.sh -r host_file_list -C "uname -a" -r command
- the ‘-r fetch_untar’ cmd does a tar.gz of the output dir on each server and then scp’s the tar.gz to an archive dir.
- the archive dir has a structure like:
- say the output dir on the servers is /root/output/tst_01 and the archive dir is ./archive_tst_01 on the local host
- then the dir structure will be ./archive_tst_01/tst_01/host_name/tst_01/(data files) where host_name is the name of the remote server.
- some of the 60secs script might depend on this structure… I’ve tried to remove this dependency but it probably is still there somewhere.
The commands to collect the data:
P=/root/output/tst_spn_v11/spn_frq; ./install_and_run_on_cloud.sh -l hosts_b19a_qct.lst -N 0 -C "mkdir -p $P; /root/60secs/do_perf3.sh -p $P -F -I 1 -x /root/60secs/extras/spin.x -X ' -w freq_sml -t 10 ' > $P/spin.txt " -r shell
P=/root/output/tst_spn_v11/spn_bw; ./install_and_run_on_cloud.sh -l hosts_b19a_qct.lst -N 0 -C "mkdir -p $P; /root/60secs/do_perf3.sh -p $P -F -I 1 -x /root/60secs/extras/spin.x -X ' -w mem_bw -t 10 -s 100m -b 64 ' > $P/spin.txt " -r command
P=/root/output/tst_spn_v11/spn_bw_L2; ./install_and_run_on_cloud.sh -l hosts_b19a_qct.lst -N 0 -C "mkdir -p $P; /root/60secs/do_perf3.sh -p $P -F -I 1 -x /root/60secs/extras/spin.x -X ' -w mem_bw -t 10 -s 32k -b 64 ' > $P/spin.txt " -r command
P=/root/output/tst_spn_v11; ./install_and_run_on_cloud.sh -l hosts_b19a_qct.lst -N 0 -p $P  -r fetch_untar -a archive_tst_spn_v11
tar czf archive_tst_spn_v11.tar.gz archive_tst_spn_v11
I scp the tar file to my macbook and then run the cmds below to generate an excel file of the data.
Analysis of 60secs data
- I untar the data files: (tar xzf …)
- I use a script like below to generate an excel file
- depends on python and uses xlsxwriter from John McNamara. https://github.com/jmcnamara/XlsxWriter
#!/usr/bin/env bash

echo "L2_bandwidth test" > archive_tst_spn_v11/tst_spn_v11/b19a_0/tst_spn_v11/spn_bw_L2/desc.txt
echo "frequency test"  > archive_tst_spn_v11/tst_spn_v11/b19a_0/tst_spn_v11/spn_frq/desc.txt
echo "memory bandwidth test" > archive_tst_spn_v11/tst_spn_v11/b19a_0/tst_spn_v11/spn_bw/desc.txt

CHART_USE_SCAT=",line_for_scatter"
CHART_SIZE_OPT=",chart_size{2,2}" # charts 2x bigger than below setting
CHART_SIZE_OPT=",chart_size{1,1,15,8}" # width_scale,height_scale[,y_units,x_units]

/Users/pfay1/repos/60secs/gen_xlsx.sh -j 0 -d archive_tst_spn_v11/tst_spn_v11/b19a_0/tst_spn_v11 -X xlsx/tst_spn_v11 -o "drop_summary,chart_sheet,all_charts_one_row${CHART_USE_SCAT},match_itp_muttley_interval,add_all_to_summary,sheet_for_file{muttley5.json=endpoints},sheet_limit{endpoints;cols_max;75},%cpu_like_top,sum_file_no_formula,$CHART_SIZE_OPT,xlsx_set_col_width{sum_all!C:C;30)" -S
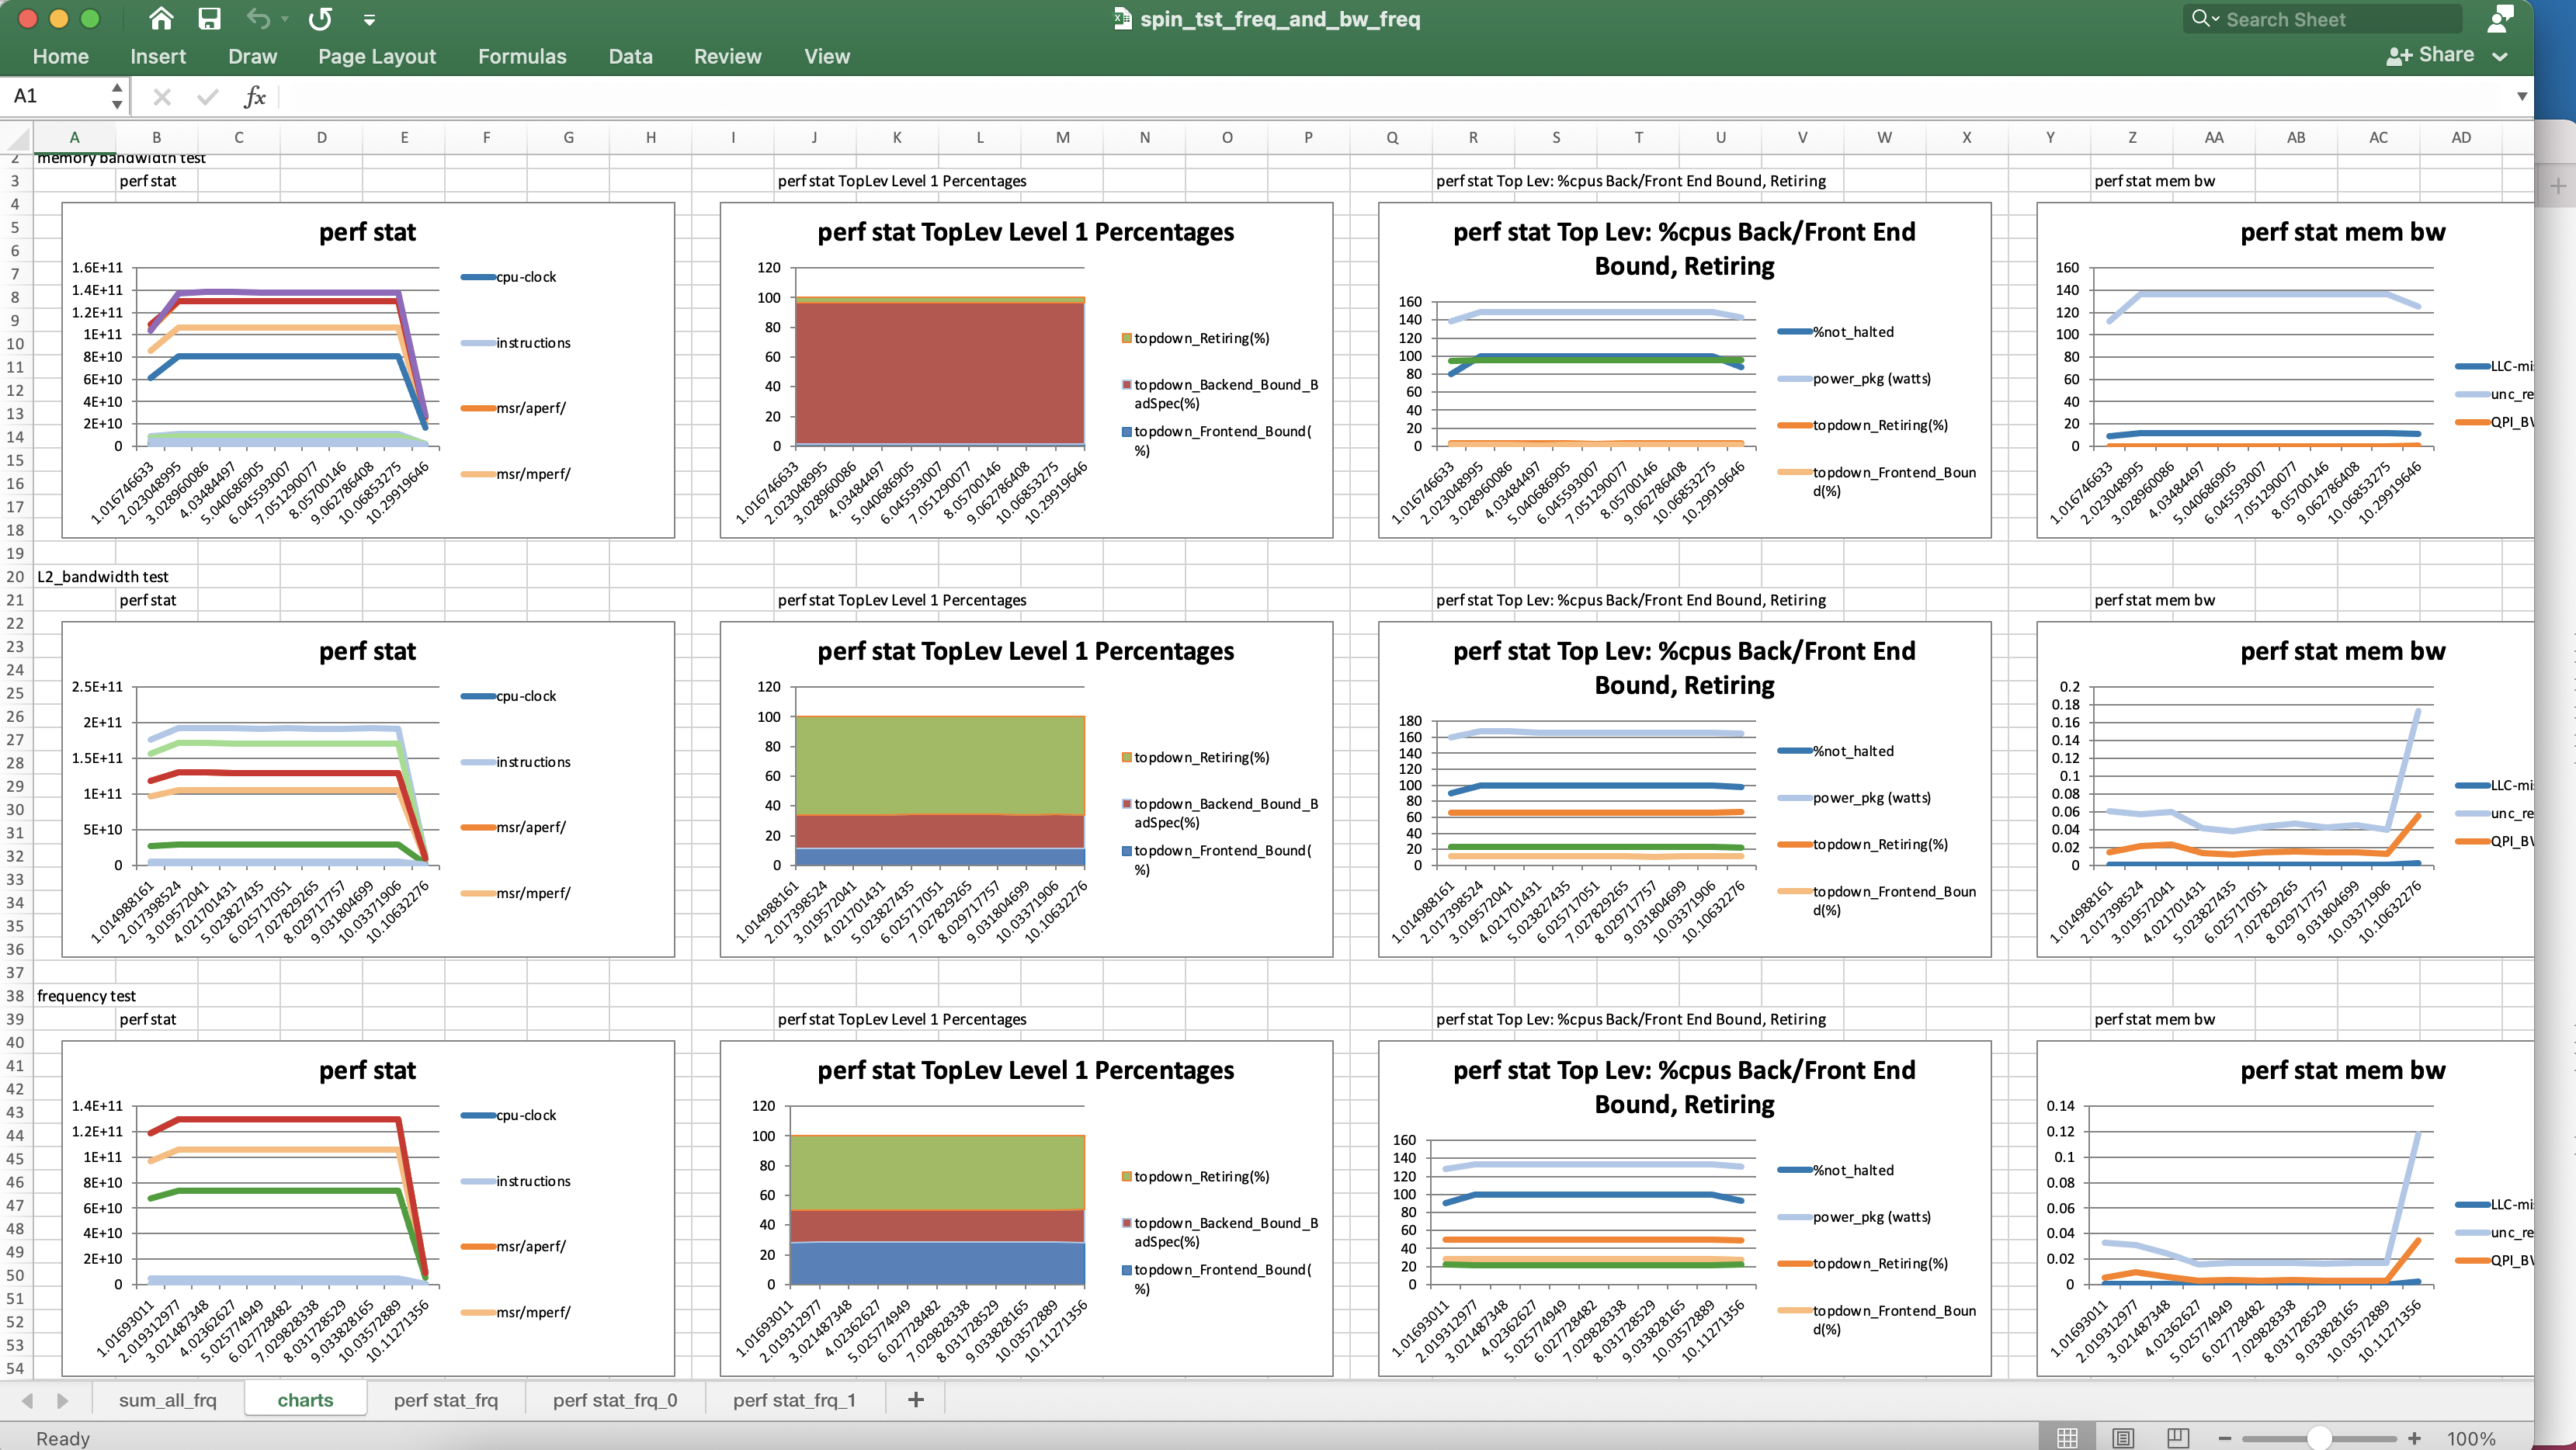
See the output xlsx file https://patinnc.github.io/60secs/sample_xlsx_files/spin_tst_freq_and_bw_freq.xlsx
- screen shot of xlsx file’s charts sheet https://patinnc.github.io/60secs/images/spin_tst_xlsx.png